


Introduction
Let's Understand What is Grafana, Loki and Promtail ?
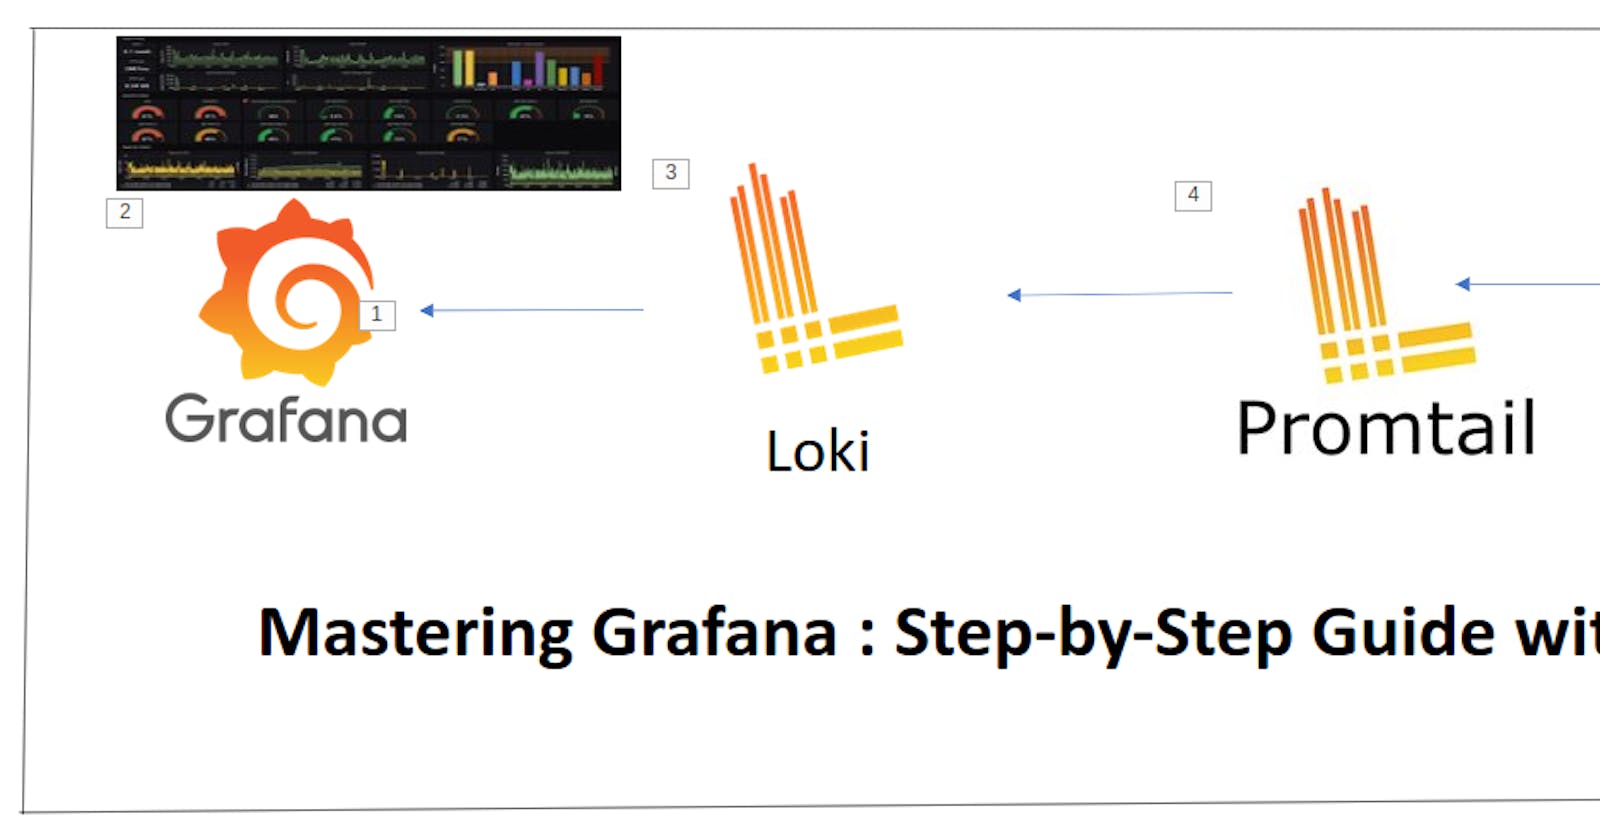
Grafana is an open-source platform that helps you manage logging, monitoring, alerting and Visualization.
Loki is Grafana's log aggregator component. it handles the logs.
Promtail is a log collector agent that collects, relabels and delivers to Loki.
About the Project :
In this project, we are going to use Grafana, Loki and Promtail. Basically, Promtail collects the data logs from the application and relabels after that delivers them to Loki. As you know Loki is a log aggregator that helps in visualization in Grafana.
Installation :
Grafana Installation :
Follow the link https://grafana.com/docs/grafana/latest/setupgrafana/installation/debian/
use the command: sudo /bin/systemctl start grafana-server
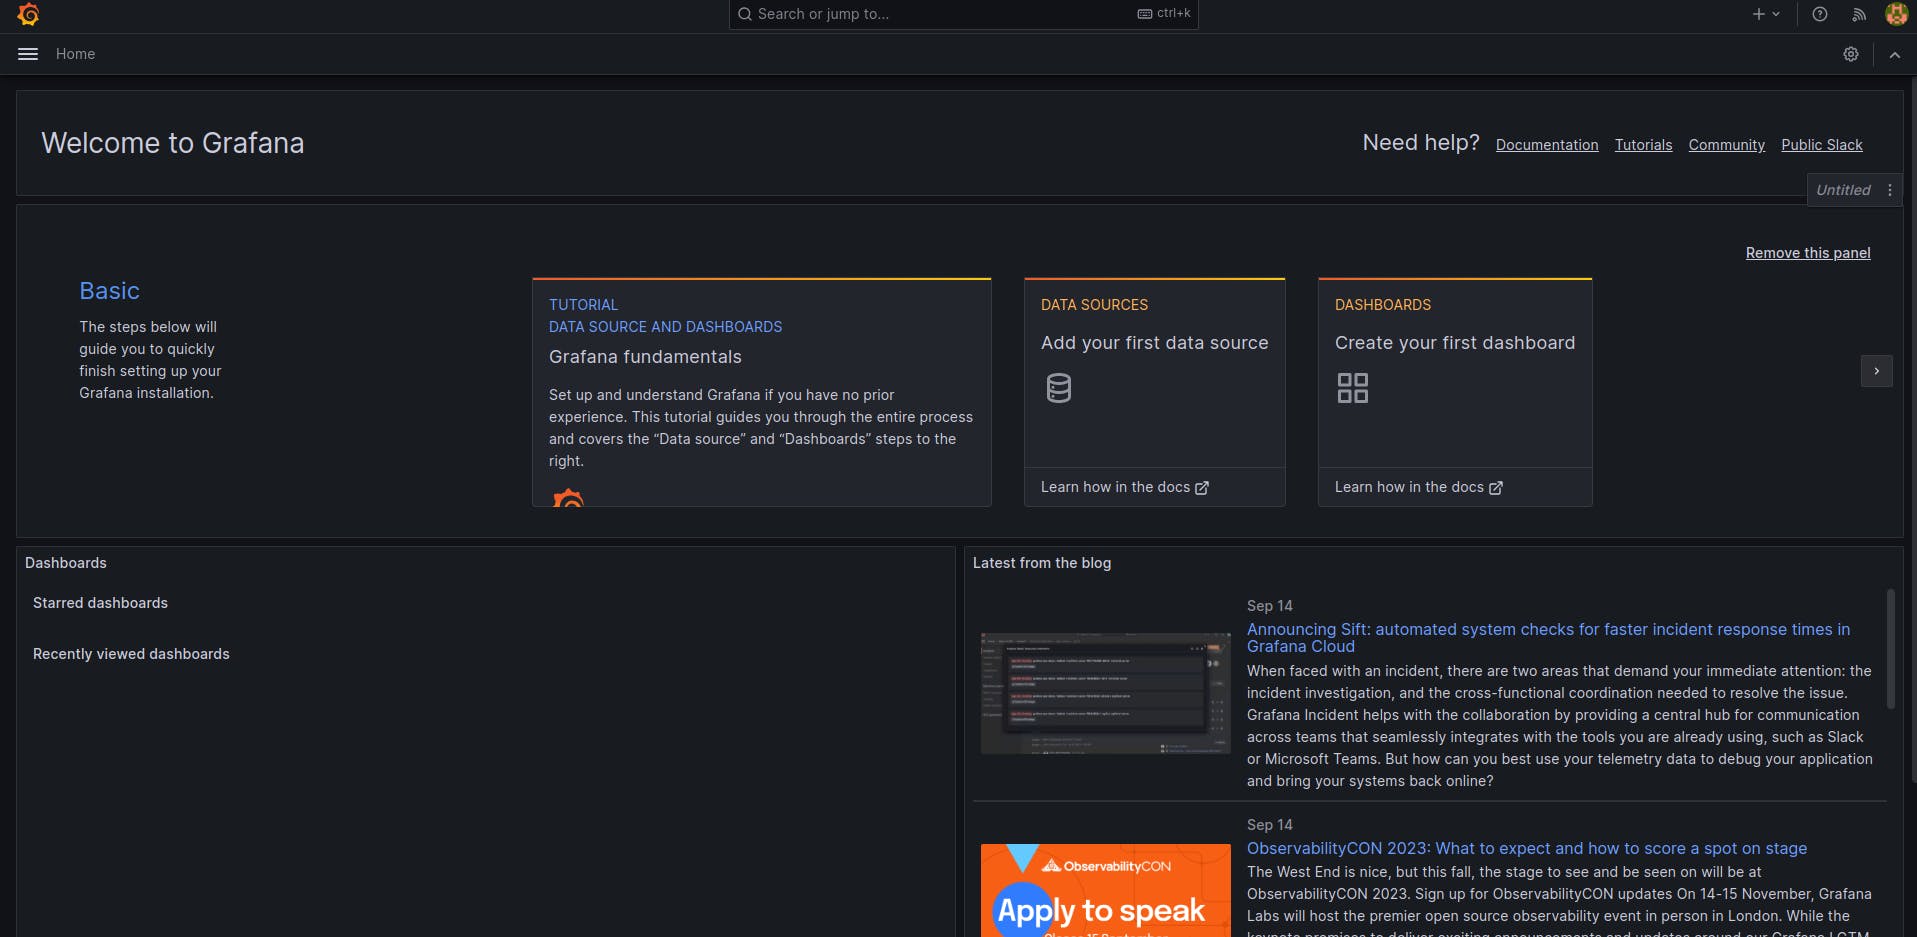
After that access the localhost 3000 where firstly give the user ID and password 'admin'
Loki installation :
There are many ways to install Loki but we prefer to install via Docker just for better communication between the containers.
Follow this link https://grafana.com/docs/loki/latest/setup/install/docker/
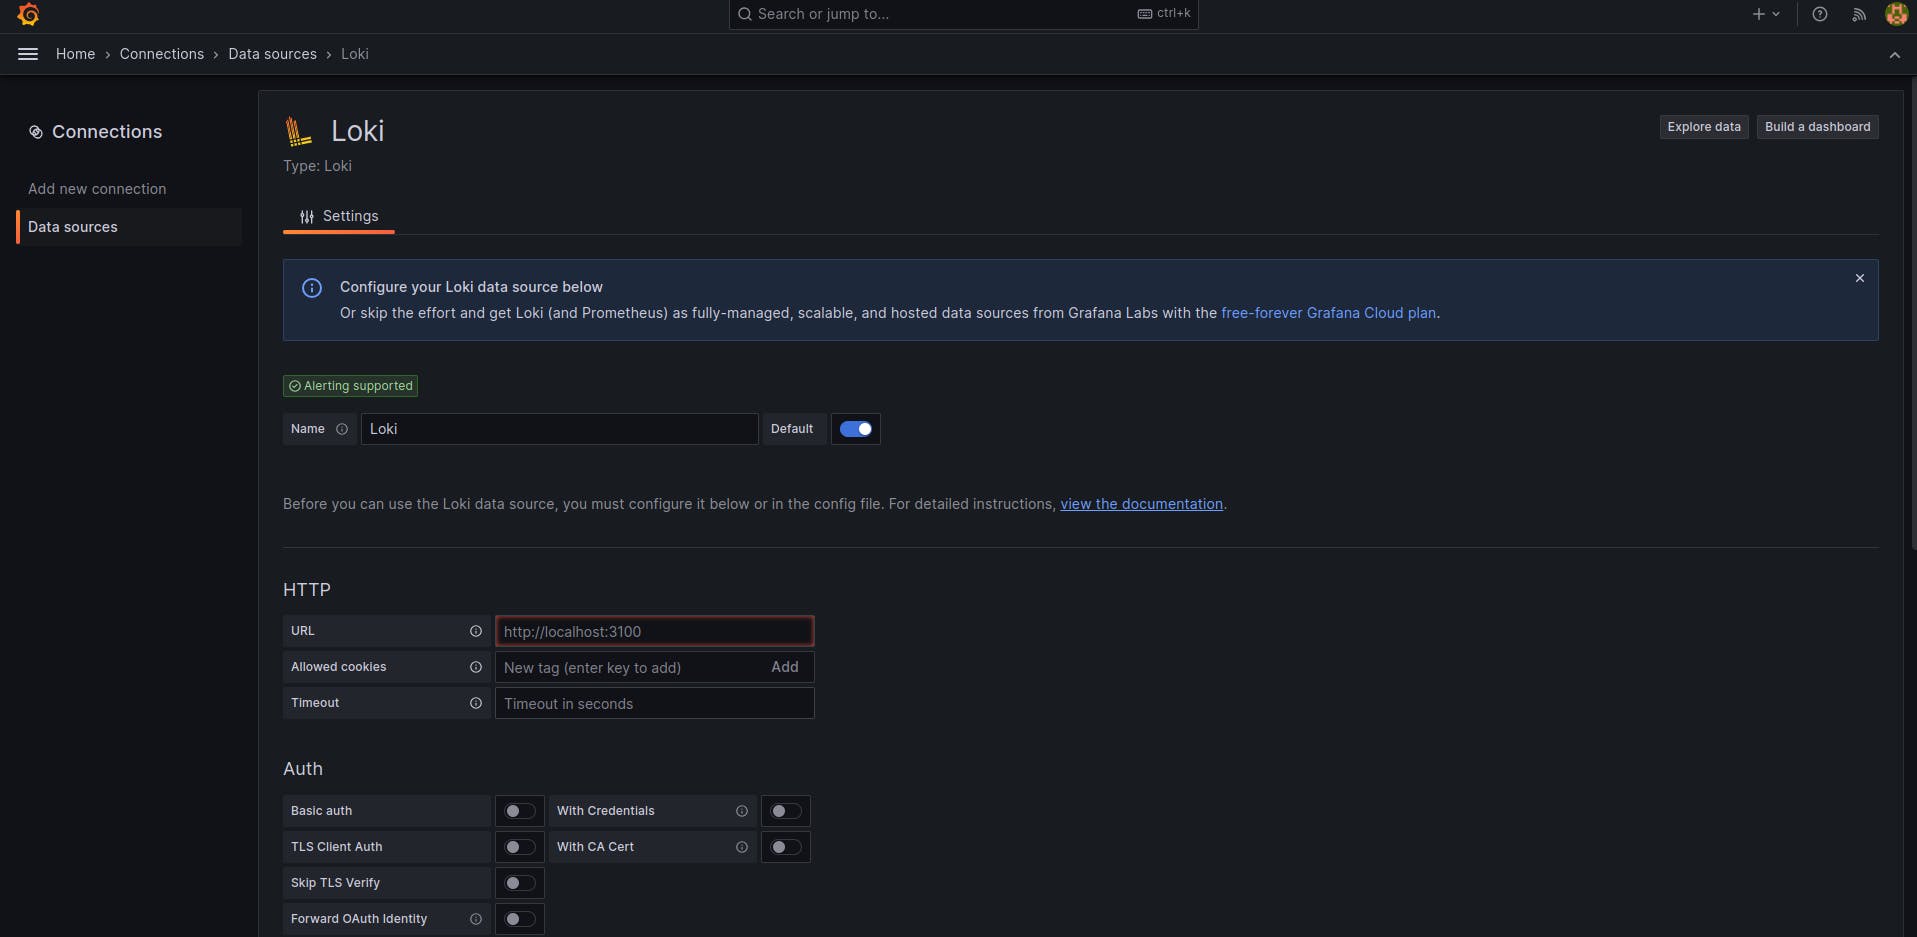
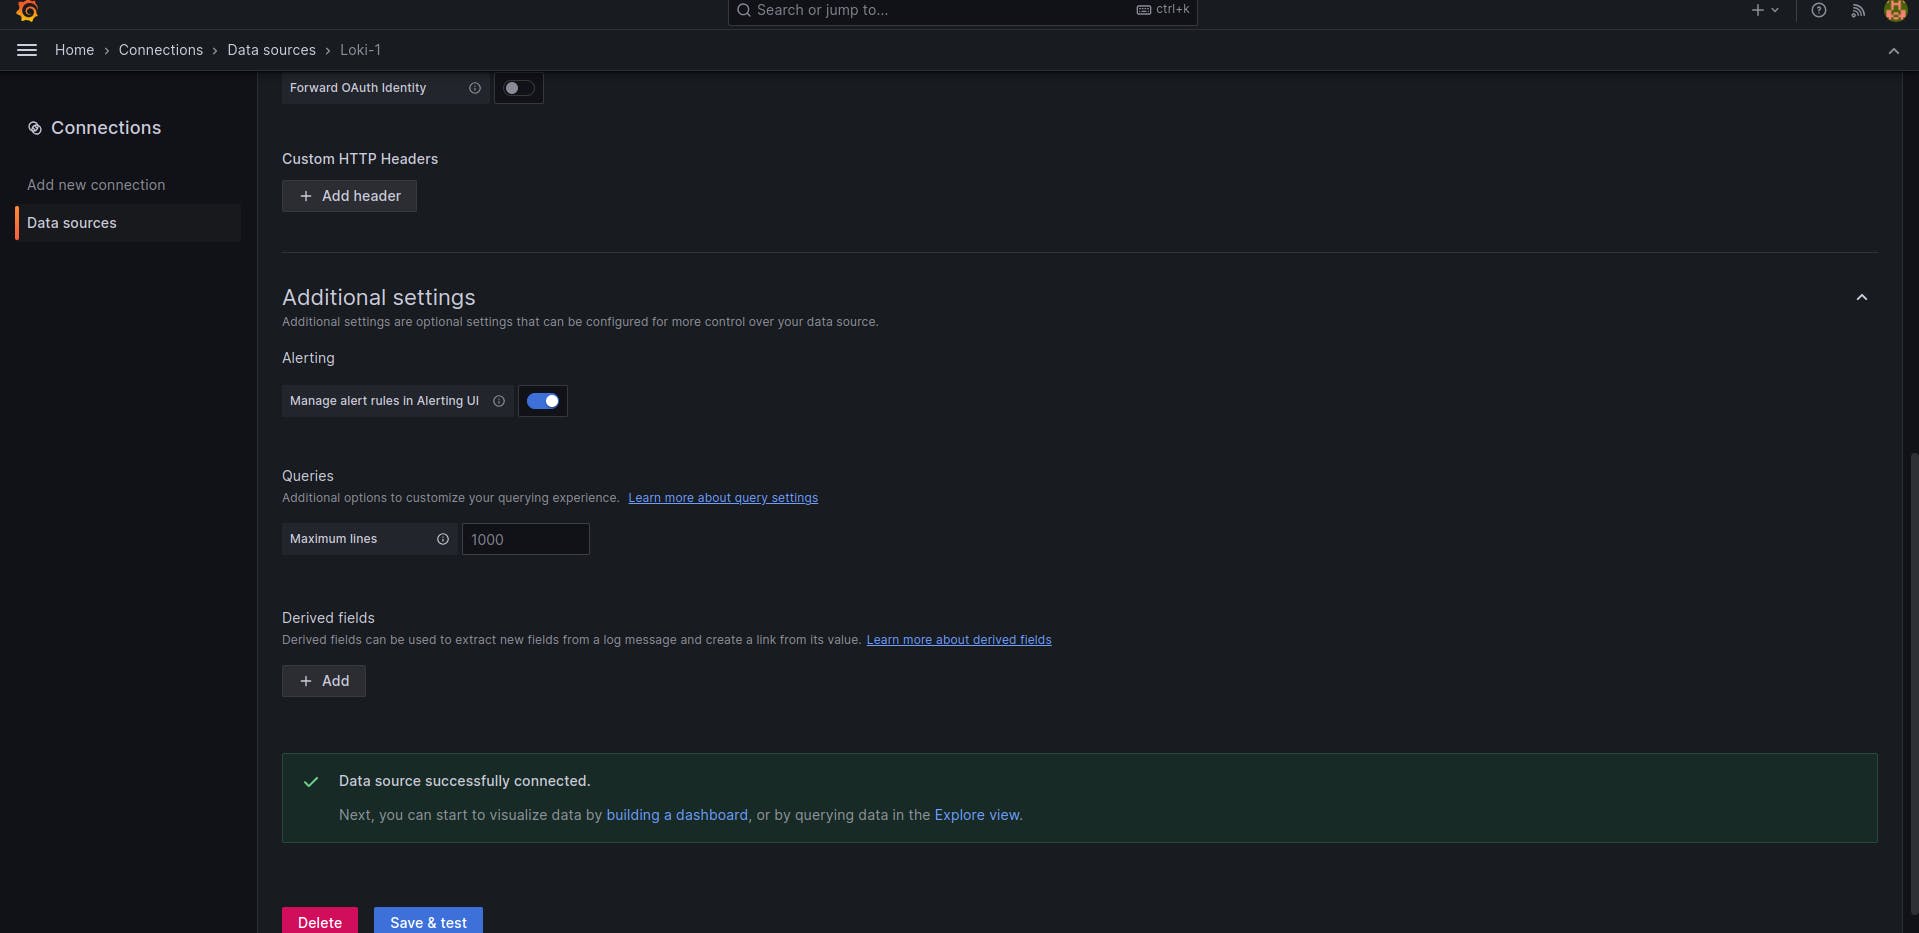
and access it on port 3100 and paste that link at Datasource -> Loki -> paste Url.
Promtail Installation :
wget https://raw.githubusercontent.com/grafana/loki/v2.8.0/clients/cmd/promtail /promtail-docker-config.yaml -O promtail-config.yaml
After this run the container :
docker run -d --name promtail -v $(pwd):/mnt/config -v /var/log:/var/log --link loki grafana/promtail:2.8.0 --config.file=/mnt/config/promtail-config.yaml

Note: Done with Installation part.
Let's Create Visualization :
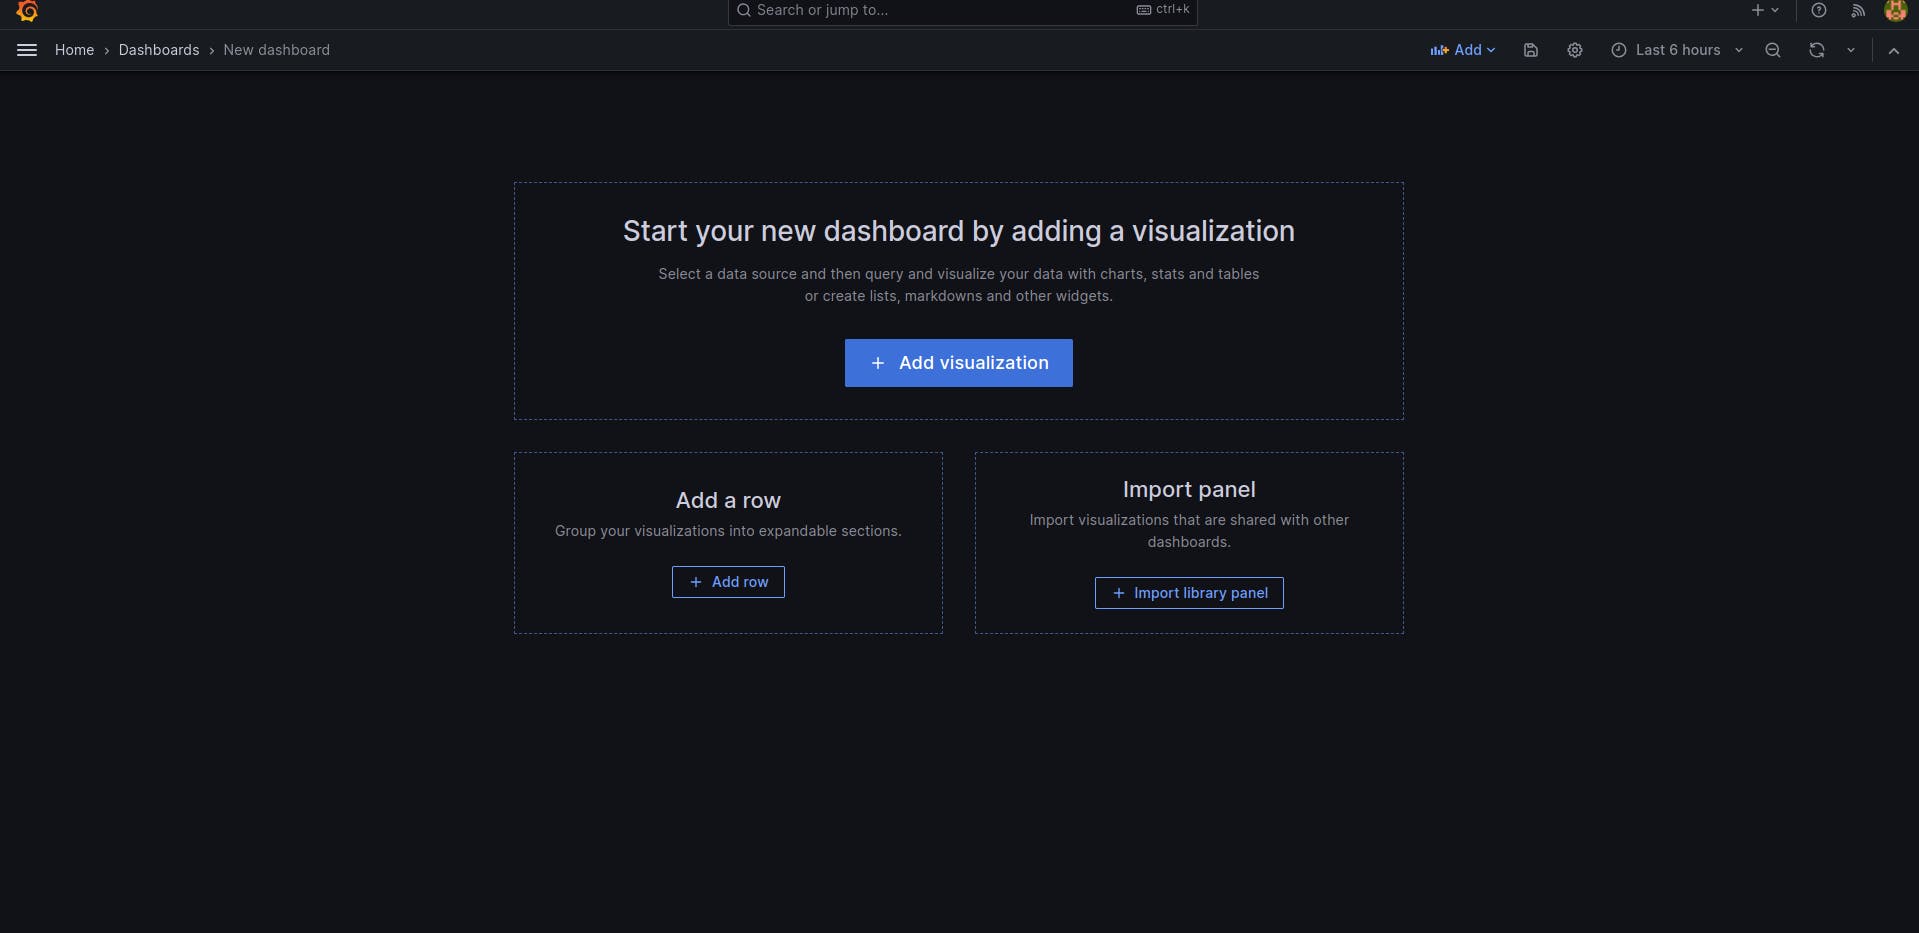
Create your First Dashboard.
Add Visualization.
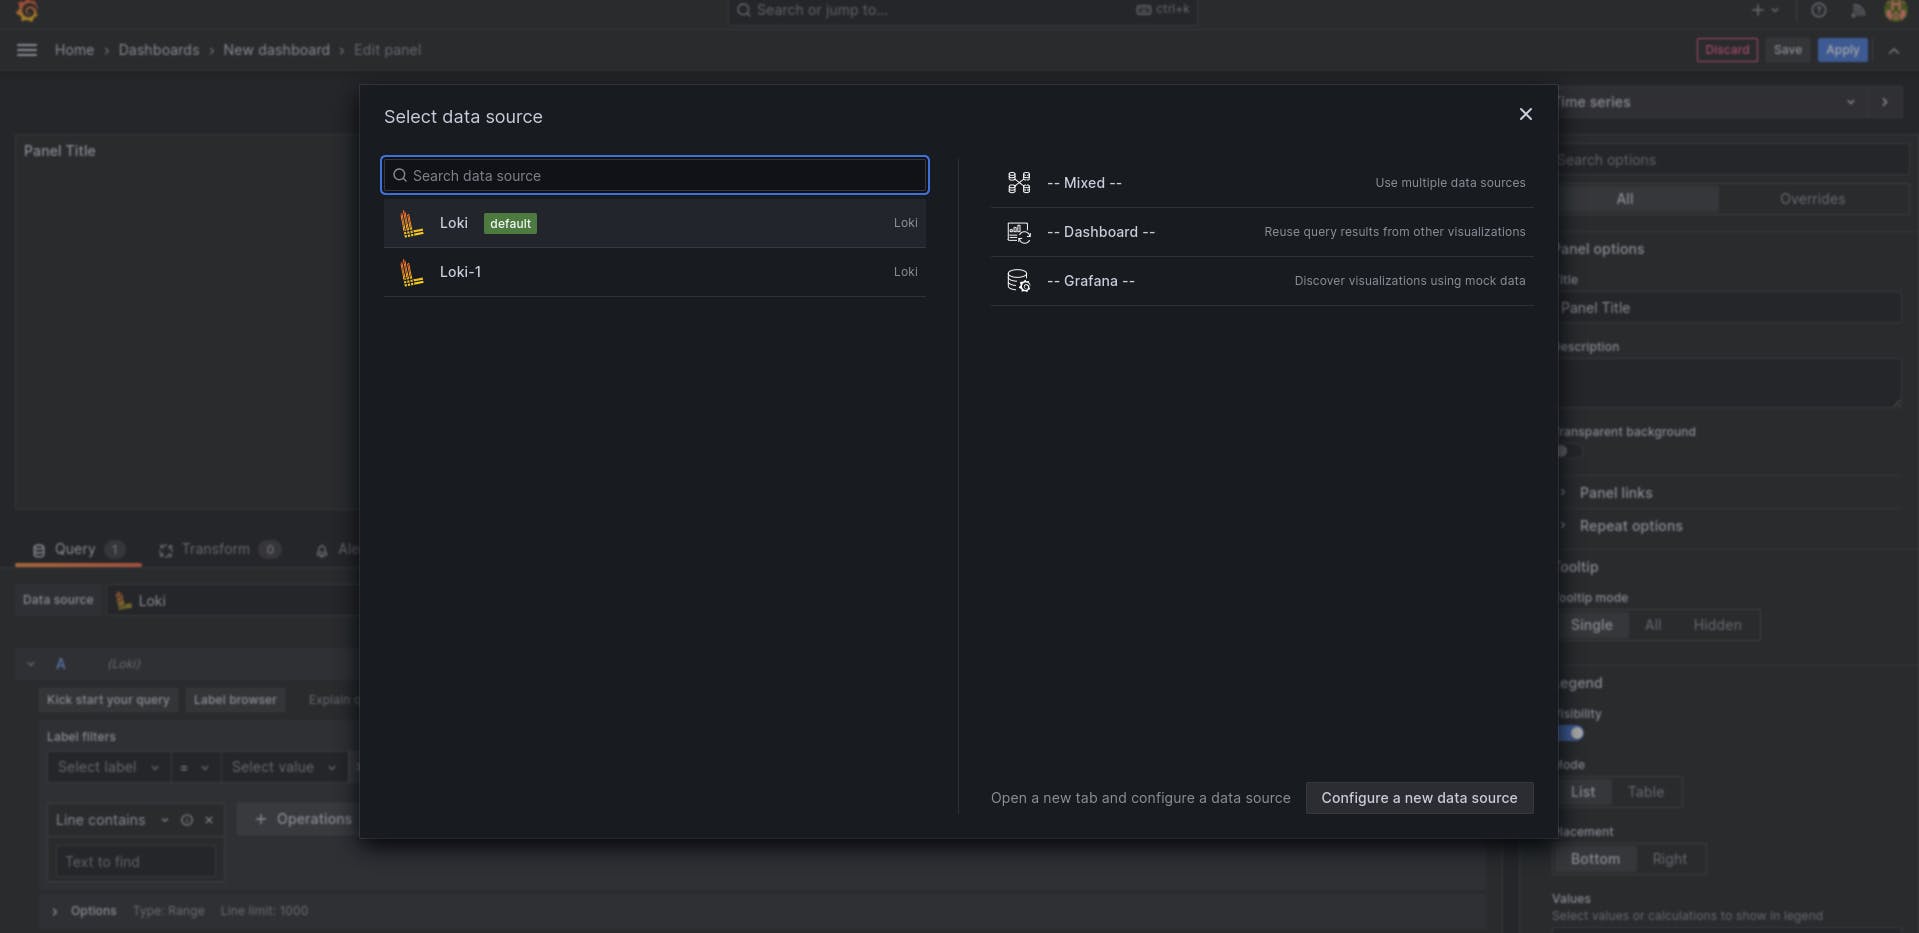
Select Loki for the log aggregator.
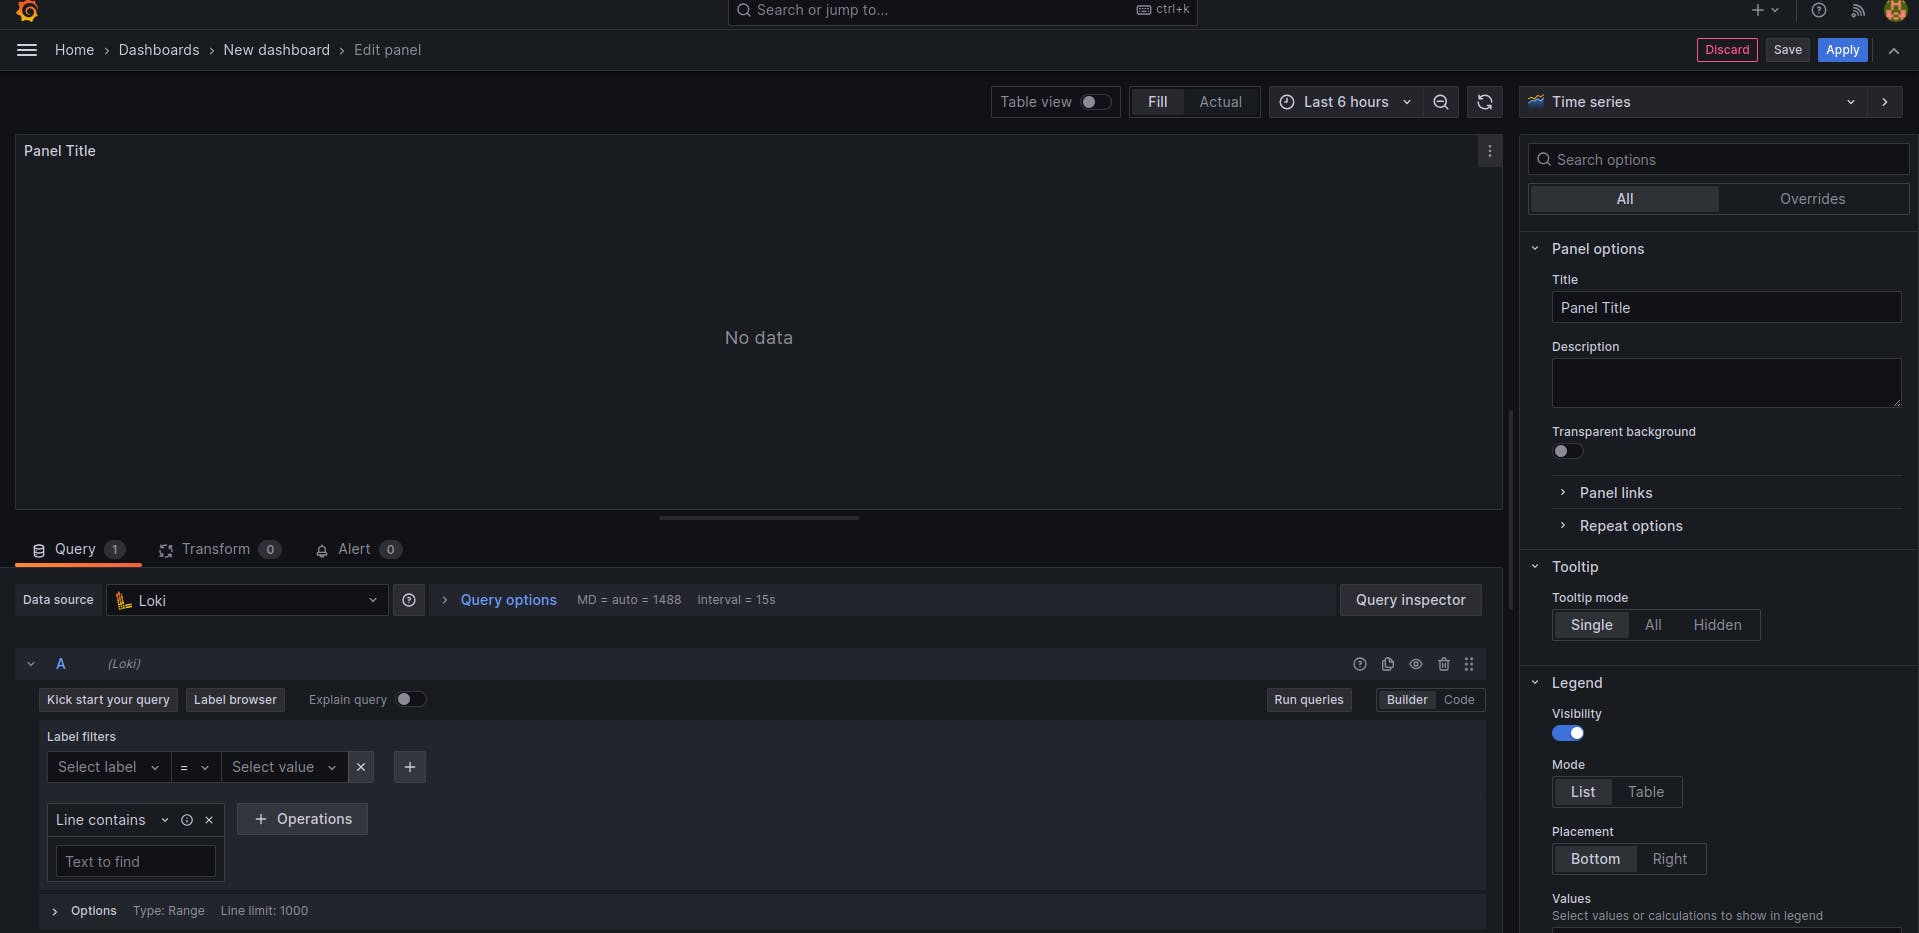
Your Dashboard is ready to work.
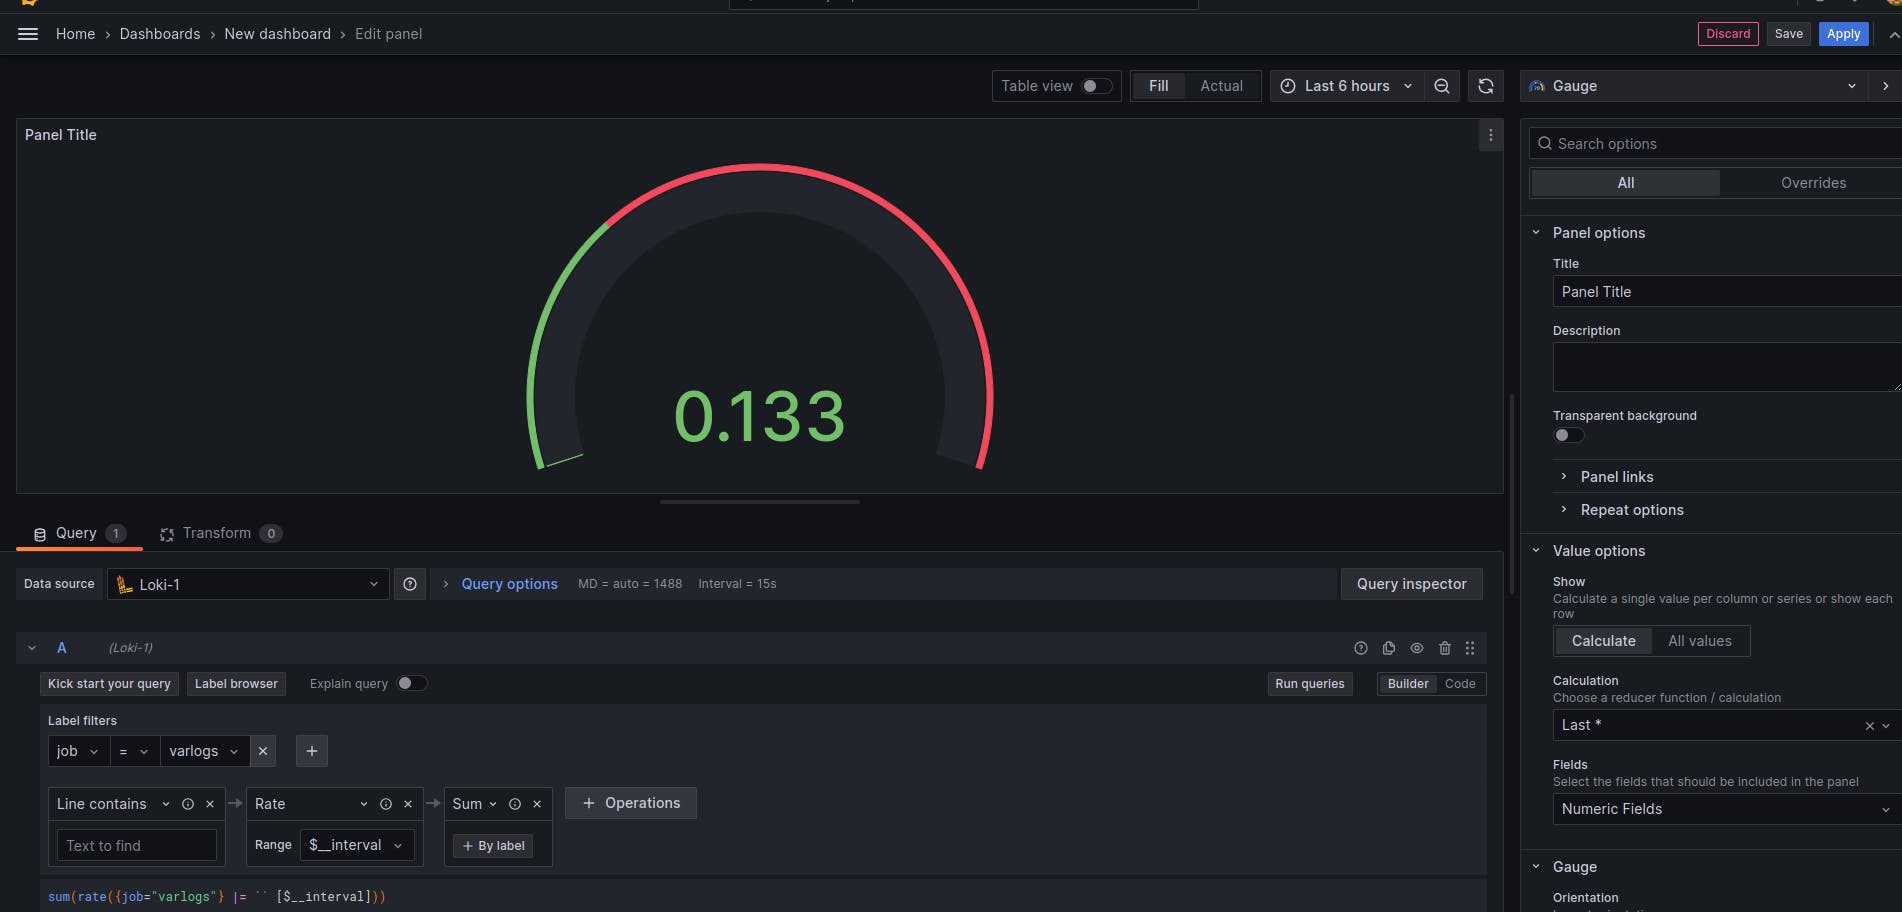
choose Label job and Select the value e.g. varlogs.
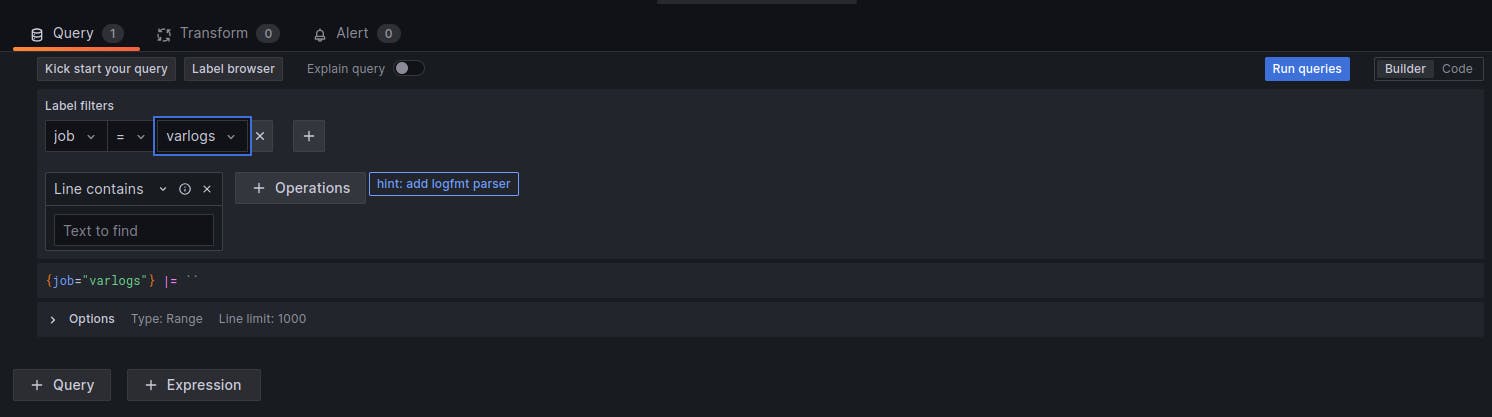
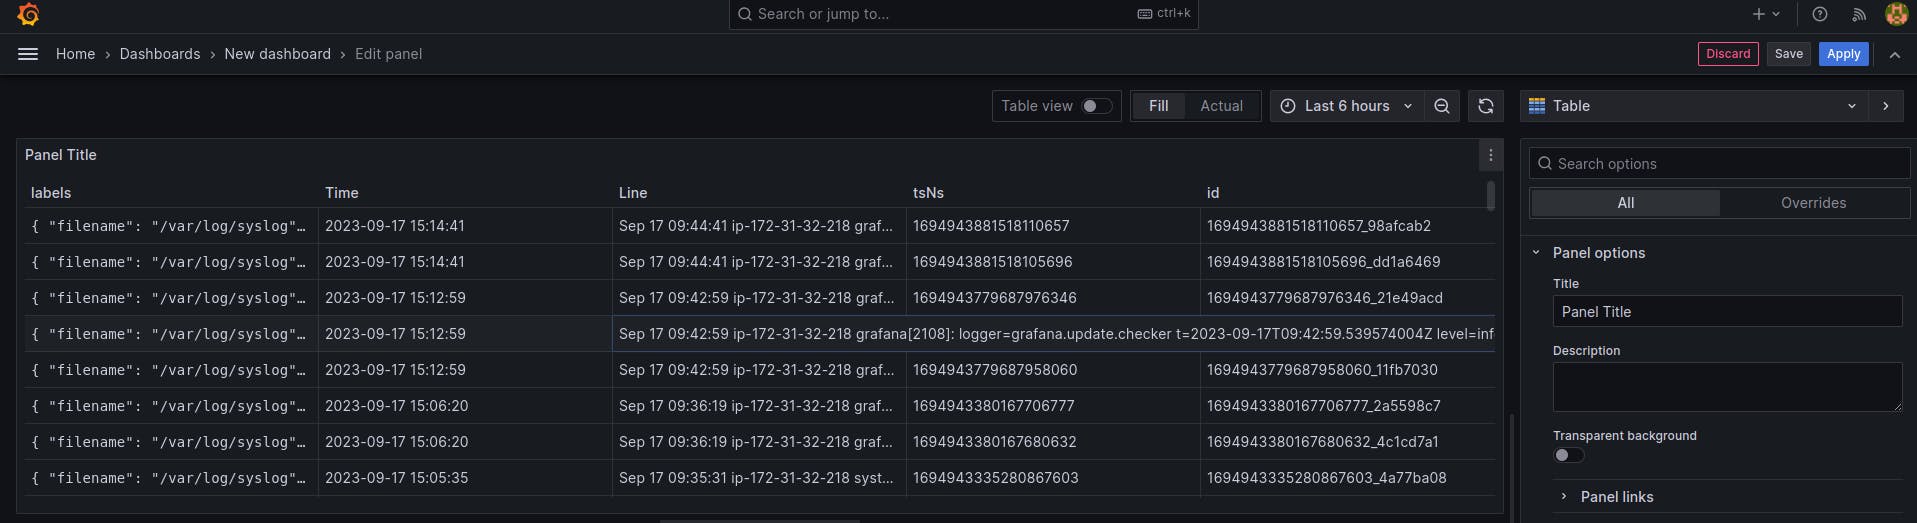
Run the queries.
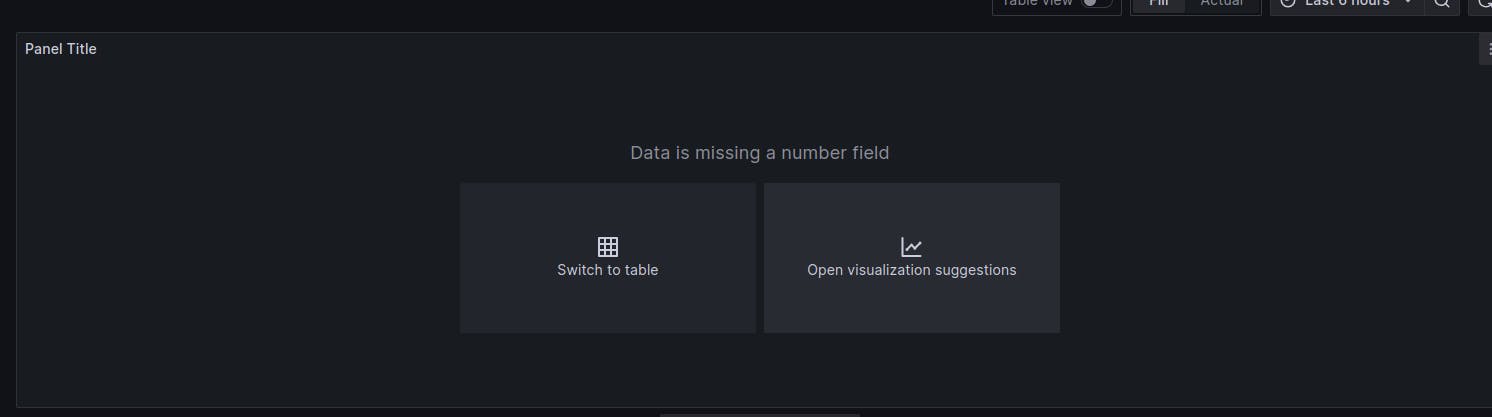
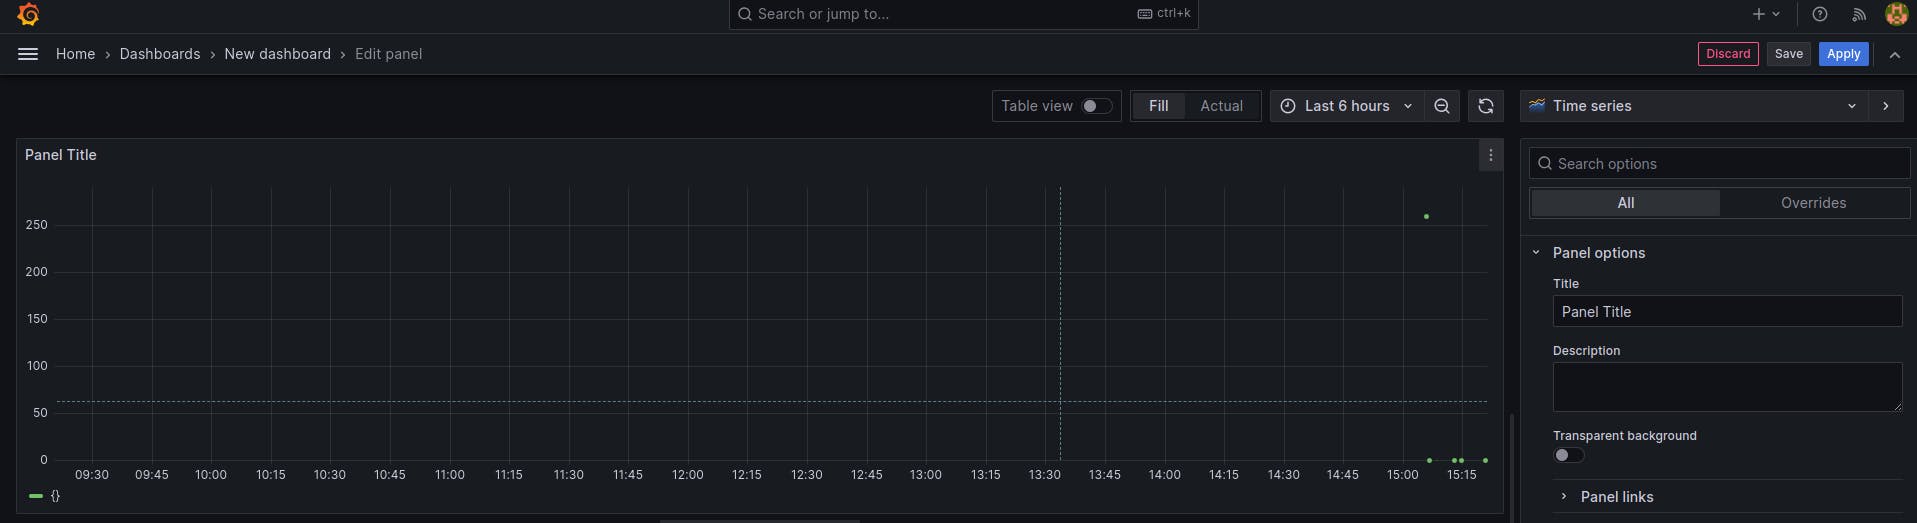
Visualize it.
use the aggregation operations like sum, min, max and many more and visualize it.
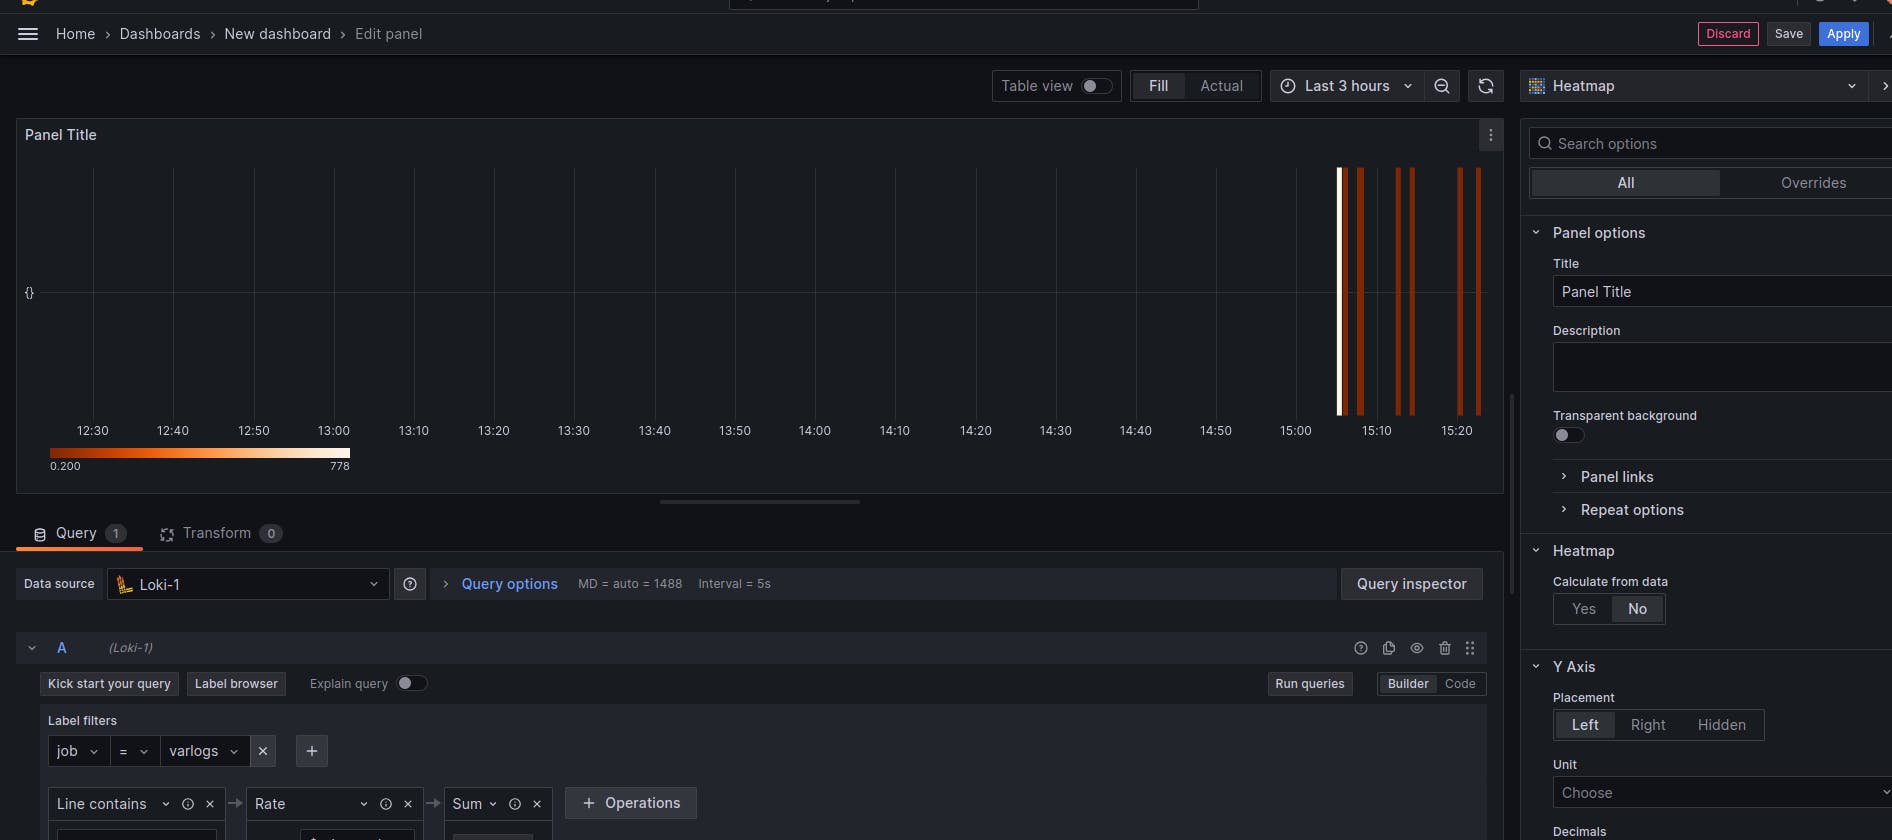
Choose Apply and Make a Dashboard.
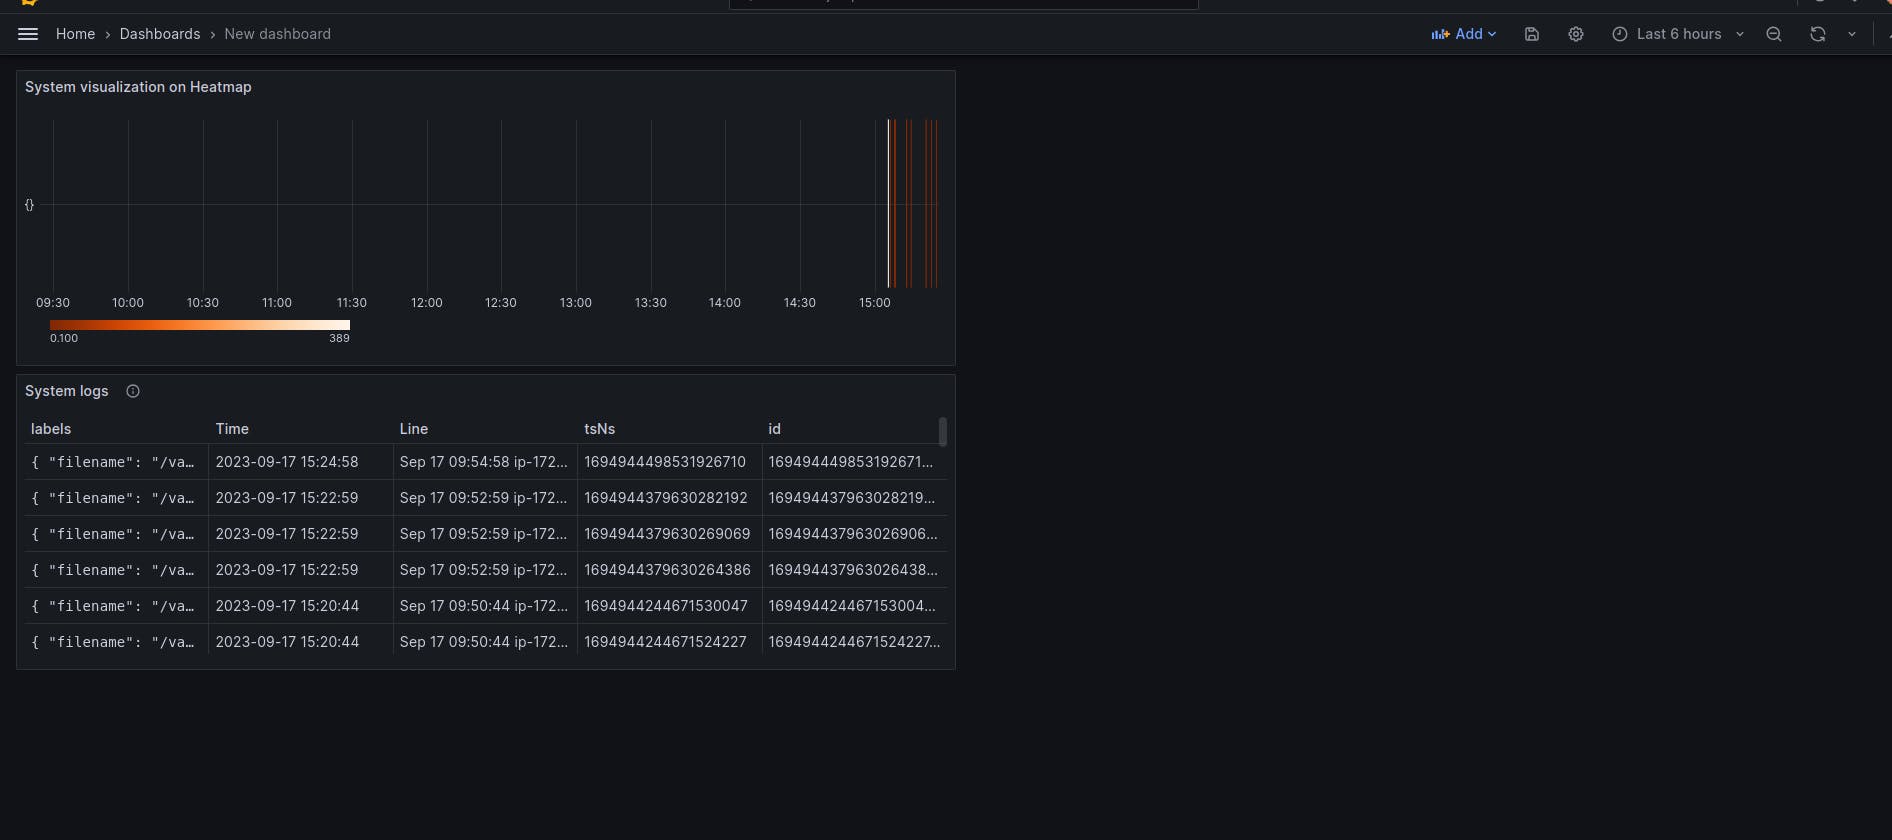
Install Nginx add logs to the promtail configuration file and Visualize it.

Conclusion :
in this, we just learned about the monitoring and visualization with Grafana with real-life-based projects.
Stay tuned for our next blog where we'll delve into the exciting world of alerts with Grafana.
🔔 Subscribe, 👍 Like, and ✍️ Comment! Your engagement fuels our content creation.
Don't miss out—connect with us for the latest updates! 🔥